Profit before tax and profit for the period, earnings per share
Compared to the previous year, profit before tax fell by 35.4% going from EUR 781.0 million to EUR 504.4 million. Without taking the non-recurring effects into account, however, the decline was only 9.2% down to EUR 709.4 million.
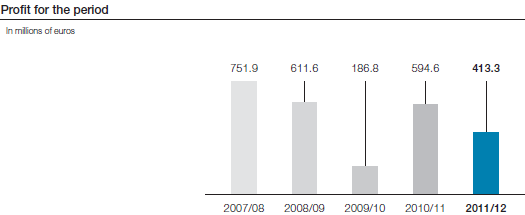
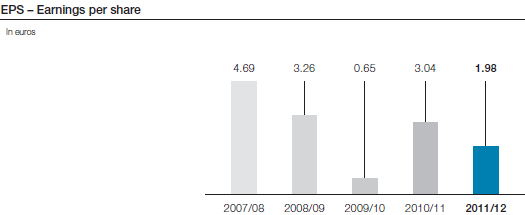
At 18.1%, the tax rate for the business year 2011/12 was atypically low due to non-recurring effects from the railway supply sector, primarily associated with the closure of the plant in Duisburg and the antitrust proceedings. This results in profit for the period1 of EUR 413.3 million, a decline of 30.5% compared to the previous year (EUR 594.6 million) and earnings per share (EPS) of EUR 1.98 (previous year: EUR 3.04).
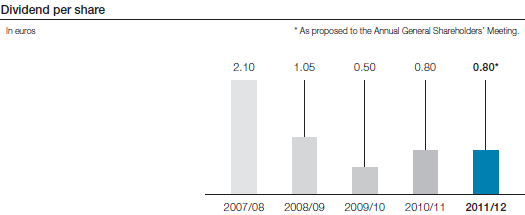
Proposed dividend: EUR 0.80 per share
Subject to the approval of the Annual General Shareholders’ Meeting of voestalpine AG on July 4, 2012, a dividend of EUR 0.80 per share will be paid to shareholders. This is the same as the dividend paid for the last business year. Based on the earnings per share (EPS) of EUR 1.98, the pay-out ratio is 40.5%, a significant increase compared to the previous year’s ratio of 26.3%. Based on the average share price in the business year 2011/12 of EUR 27.78, the dividend yield is 2.9%.
Gearing continues to fall
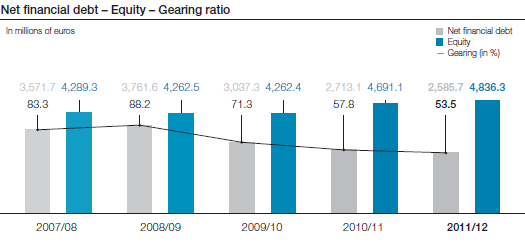
The debt situation of the voestalpine Group continued to ease up in 2011/12. We were able to reduce the gearing ratio (net financial debt as a percentage of equity) from 57.8% to 53.5% compared to the reporting date of the previous year. On one hand, this was made possible by equity growth, which went from EUR 4,691.1 million in the previous year to EUR 4,836.3 million as a result of higher earnings, a plus of 3.1%; on the other hand, positive cash flow reduced the net financial debt as of the end of March 2012 to EUR 2,585.7 million. This corresponds to a reduction of the debt by 4.7% from EUR 2,713.1 million, the figure at the end of the previous business year.
Cash flow
In the business year 2011/12, cash flow from operating activities was EUR 856.5 million, a decline of 10.6% compared to the previous year’s figure of EUR 957.6 million. The reasons for this decline can be found in the somewhat weaker operating performance on one hand and, on the other, in the fact that working capital rose by EUR 137.8 million. This increase is primarily due to significantly higher revenue. In relative terms, working capital was actually reduced slightly to 16.9% of revenue in comparison to 17.4% in the previous year.
At EUR 478.6 million, negative cash flow from investing activities rose in the business year 2011/12 by 36.9% compared to the previous period (EUR 349.7 million). This was caused mainly by the fact that, after the consolidation phase during recent years, investments in property, plant and equipment and intangible assets were up again. Nevertheless, investments were lower than depreciation (EUR 597.7 million) in this business year as well.
At EUR 933.7 million, negative cash flow from financing activities went up significantly compared to the previous year’s figure of EUR 407.4 million. The background of this development lies on one hand in the higher dividend payment in June 2011 compared to the previous year and, on the other, to scheduled repayments of loans and debt securities.
1 Before non-controlling interests and interest on hybrid capital.
Business performance of the voestalpine Group – In accordance with IFRS, all figures after application of the purchase price allocation (ppa).

