voestalpine Group – Global presence
Represented in more than 60 countries
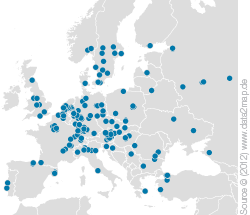
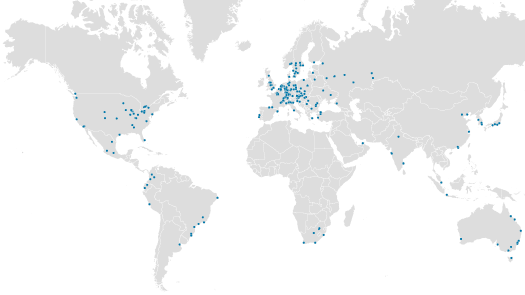
voestalpine is a globally active Group with a number of specialized and flexible companies that produce, process, and further develop high-quality steel products. The Group is represented by approximately 360 production and sales companies in more than 60 countries.

Leading positions in the core segments
With its highest quality flat steel products, voestalpine is one of Europe's leading partners to the automative, energy, white goods, and consumer goods industries. Furthermore, voestalpine is the world market leader in turnout technology, tool steel, and special sections as well as number one in Europe in the production of special rails. The voestalpine Group generated revenues of EUR 12.1 billion in the business year 2011/12 and has 46,500 employees worldwide.
Development of the Key Figures
| (XLS:) Download |
|
In millions of euros |
|
2007/08 |
|
2008/09 |
|
2009/10 |
|
2010/11 |
|
2011/12 |
|
|
|
|
|
|
|
|
|
|
|
|
|
Revenue |
|
10,481.2 |
|
11,724.9 |
|
8,550.0 |
|
10,953.7 |
|
12,058.2 |
|
Profit from operations before depreciation (EBITDA) |
|
1,836.5 |
|
1,710.1 |
|
1,004.3 |
|
1,605.6 |
|
1,301.9 |
|
|
17.5% |
|
14.6% |
|
11.7% |
|
14.7% |
|
10.8% | |
|
Profit from operations (EBIT) |
|
1,152.6 |
|
988.7 |
|
352.0 |
|
984.8 |
|
704.2 |
|
|
11.0% |
|
8.4% |
|
4.1% |
|
9.0% |
|
5.8% | |
|
Profit before tax (EBT) |
|
979.6 |
|
700.0 |
|
183.3 |
|
781.0 |
|
504.4 |
|
Profit for the period1 |
|
751.9 |
|
611.6 |
|
186.8 |
|
594.6 |
|
413.3 |
|
EPS – Earnings/ share (euros) |
|
4.69 |
|
3.26 |
|
0.65 |
|
3.04 |
|
1.98 |
|
Total assets |
|
12,601.8 |
|
12,846.5 |
|
12,294.1 |
|
13,076.4 |
|
12,612.1 |
|
Cash flows from operating activities |
|
1,135.8 |
|
1,357.9 |
|
1,606.1 |
|
957.6 |
|
856.5 |
|
Investments in tangible and intangible assets and interests |
|
3,910.1 |
|
1,078.9 |
|
542.5 |
|
422.7 |
|
574.6 |
|
Depreciation |
|
683.9 |
|
721.3 |
|
652.3 |
|
620.8 |
|
597.7 |
|
|
4,289.3 |
|
4,262.5 |
|
4,262.4 |
|
4,691.1 |
|
4,836.3 | |
|
|
3,571.7 |
|
3,761.6 |
|
3,037.3 |
|
2,713.1 |
|
2,585.7 | |
|
Net financial debt in % of equity |
|
83.3% |
|
88.2% |
|
71.3% |
|
57.8% |
|
53.5% |
|
Return on capital employed (ROCE) |
|
13.4% |
|
11.4% |
|
4.4% |
|
12.4% |
|
8.6% |
|
Market capitalization, end of period |
|
7,006.4 |
|
1,645.0 |
|
5,043.3 |
|
5,585.1 |
|
4,255.0 |
|
Number of outstanding shares as of March 31 |
|
159,235,738 |
|
167,003,706 |
|
168,390,878 |
|
168,581,289 |
|
168,749,435 |
|
Share price, end of period (euros) |
|
44.00 |
|
9.85 |
|
29.95 |
|
33.13 |
|
25.22 |
|
Dividend/share (euros) |
|
2.10 |
|
1.05 |
|
0.50 |
|
0.80 |
|
0.802 |
|
Employees |
|
46,170 |
|
44,004 |
|
42,021 |
|
45,260 |
|
46,473 |
|
|
|
|
|
|
|
|
|
|
|
|
|
1 Before deduction of non-controlling interests and interest on hybrid capital. | ||||||||||
|
2 As proposed to the Annual General Shareholders’ Meeting. | ||||||||||


